Weather and Climate Summary and Forecast
July 2025 Report
Gregory V. Jones, Ph.D.
July 3, 2025
Summary:
- June 2025 was generally warmer than average* for the majority of the west. for most of the western regions of the country. The exception is the slightly cooler coastal zones in California.
- The month was largely dry over the west, with most areas seeing 50% or less than normal. Early season monsoon flow brought significant moisture to the southwest, with some areas experiencing over 300% of normal for the month.
- Drought levels continued to rise in the West, especially in California and the Southwest, while drought has expanded or is likely to develop further across the PNW and Rockies.
- A warm start to July will give way to more pleasant temperatures for most over the 4th of July. Heat builds back into mid-month with the warmest temperatures of the season likely. Coastal zones in California will likely remain near average, then ramp up later in the month. The east side of the mountains will experience periods of thunderstorm activity, and monsoon flow is expected in the southwest.
- The overall July forecast is for warmer than normal temperatures and seasonal dry conditions for the entire western US.
- The 90-day forecast is also pointing to a strong probability of a warmer and drier western US. Models are hinting at least a few periods of prolonged heat along with extremely dry conditions, which increase fire risk. Monsoon activity is also forecast for much of the southwest.
*Note that all references to normal or averages in this report are to the 1991-2020 climate normal for each weather/climate parameter unless stated otherwise. See this website for more information on climate normals.
For a PDF of this report, click here.
Past Month and Year to Date: Even with a very cool and moderately wet period in the third week in June, the month ended up largely warm and dry over most of the western US (Figure 1). Most regions saw temperatures from 1-5°Fabove average, with portions of the Rockies even reaching 6-8 degrees above average. A cooler than average month was seen along the coast in central California and in the eastern portions of Colorado and New Mexico. Other cooler than average conditions in June were seen in the northern Plains and Front Range of Colorado (1-5 degrees; not shown), otherwise the rest of the country was warmer than average for the month. A stark contrast was seen in June between the extremely dry conditions over most of California, the Great Basin, PNW, and northern Rockies, and the much wetter than average conditions due to monsoon flow in the southwest (Figure 1). For the rest of the country, a dry month was seen in the Great Lakes and New England, while most of the rest of the eastern US saw higher than average precipitation (not shown).
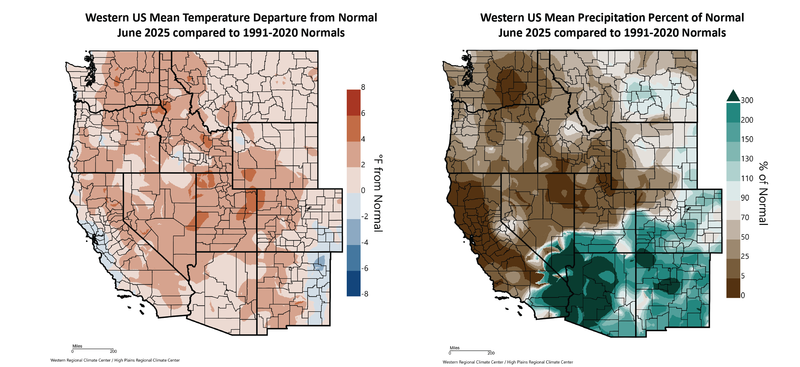
Figure 1 – Western US June 2025 temperature departure from normal (left) and percent of normal precipitation (right; images from WestWide Drought Tracker, Western Region Climate Center; University of Idaho).
A warm June has moved year to date temperatures in the western US to largely warmer than average. However, the central to southern areas are running the warmest while portions of the intermountain PNW, northern Rockies, and Front Range are closer to average or below average (Figure 2). Coastal zones in California, portions of Oregon, northwestern Washington, and central Idaho have been 0.5-1.5 degrees cooler than average, while interior California, the Great Basin, much of the Four Corners, and central and southern Rockies have been 0.5-3.5 degrees warmer than average. Most of the rest of the country continues to experience largely warmer than average temperatures since the first of the year, running 1-3 degrees above average from Texas and the Mississippi River valley eastward. The northern to central Plains have seen closer to average or slightly cooler year to date conditions (not shown).
A dry June over most of the west has moved year to date precipitation further to the dry side (Figure 2), although areas from northern California into southern and central Oregon, continuing eastward to the northern Rockies, have seen a wetter than average first six months of the year. The rest of the western US has remained dry, with Washington moderately drier than average, and central to southern California, the southwest, Four Corners currently running 5-70% of normal. The 90 day forecast has increased chances for monsoon activity, which will likely alleviate the dry conditions in portions of the southwest (see Forecast periods below). Year to date drier than average conditions continue across the central to northern Plains, the southeast, and Florida (not shown). The late winter through early summer storm has a large area from Texas into the Ohio River valley, running roughly 150-300% of average precipitation year to date.
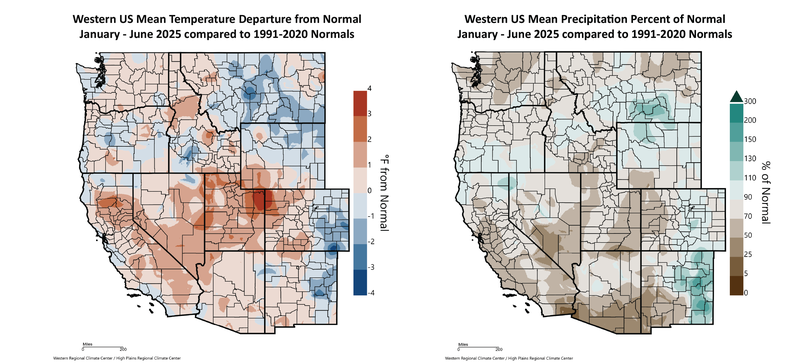
Figure 2 – Western US year to date (January 1 through June 30, 2025) temperature departure from normal (left) and percent of normal precipitation (right; images from WestWide Drought Tracker, Western Region Climate Center; University of Idaho).
Heat Accumulation: A relatively warm June has accelerated growing degree-days (GDDs) over the western US. GDD values for March through June 2025 are mostly above the 1991-2020 climate normals (Figure 3). However, portions of the Rockies, coastal zones in California, portions of the southwest, and locations around the PNW are currently running near average to 200 GDD below average. Elsewhere, inland regions in California, western and eastern valleys in the PNW, the Great Basin, Idaho, and Montana are mostly seeing conditions that are 50-300 GDD above average (Figure 3). In terms of days ahead or behind normal growing degree-day accumulation, the data in Figure 3 finds the warmest regions continuing to run 4-20 days ahead of normal, while the coolest regions are running 2-14 days behind normal accumulation for this point in the vintage (not shown).
Oregon experienced a June that was 1.8-5.0 degrees warmer than average resulting in heat accumulation (GDD) amounts that are currently 19-39% above the 1981-2010 climate normals, and 4-30% above the 1991-2020 climate normals for the Rogue Valley, Umpqua Valley, Walla Walla Valley, and Willamette Valley (Figure 4). Stations in Roseburg and Medford are currently tracking just below the same GDD as the 2015 vintage, one of the warmest years on record in Oregon. Compared to the 2024 vintage, the four locations in Figure 4 are running 4% (McMinnville), 8% (Medford), 8% (Milton-Freewater), to 15% (Roseburg) above the same point last year.
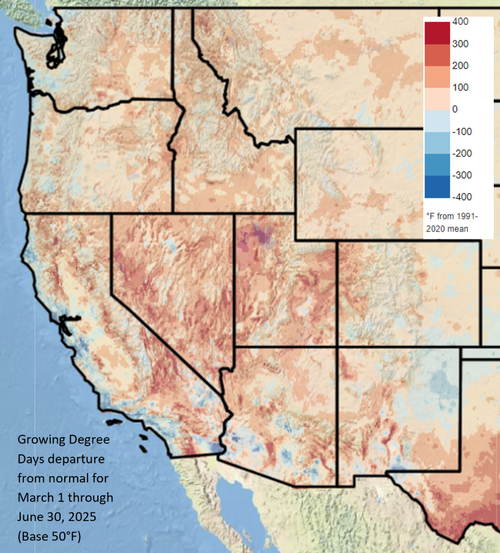
Figure 3 – Western US March through June 2025 growing degree-days (image from Climate Impacts Research Consortium, University of Idaho).
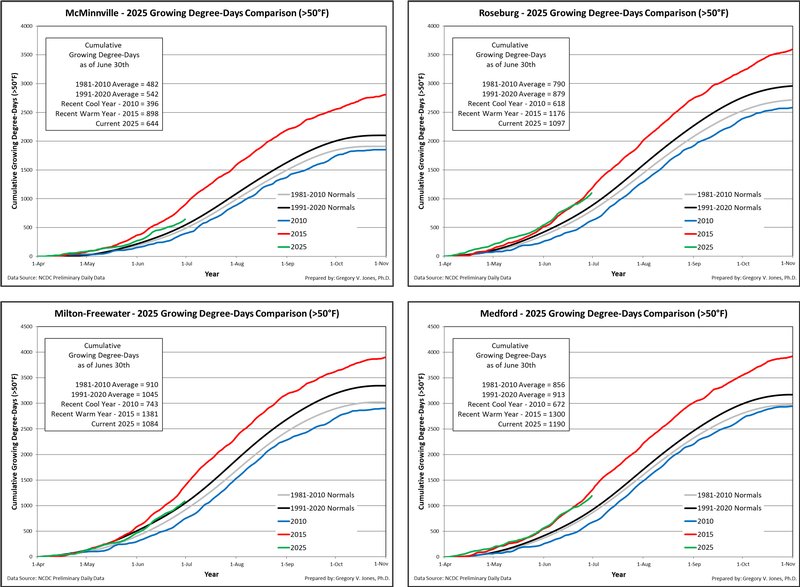
Figure 4 – Cumulative growing degree-days (base 50°F, no upper cut-off) for McMinnville, Roseburg, Milton-Freewater, and Medford, Oregon. Comparisons between the current year (2025) and a recent cool year (2010), a recent warm year (2015), and both the 1981-2010 and 1991-2020 climate normals are shown (NCDC preliminary daily data).
Drought Watch – General improvements in drought conditions continued across most of the eastern half of the country while the western US was quite dry (Figure 1) and saw elevated drought conditions during June (Figure 5). With a relatively wet east and dry west, the overall drought footprint over the continental US did not change much in June, dropping slightly to close to 49%, with the most extreme drought categories declining to close to 15%. The dry spring in the west has transitioned into the normally dry summer, increasing drought concerns in the western US, with the area from southern California, across much of the southwest, and into the Rockies continuing to have the most prolonged and severe drought situation in the west (Figure 5). The overall drought footprint in the west increased from last month to over 85% now, with the most extreme categories remaining just over 31% t. Washington saw its overall drought footprint jump in June to just over 93% of the state, although the state continues to have relatively little area in the most extreme categories of drought (<2%). Oregon also saw its drought footprint increase from just under 36% of the state to 100% of the state in some level of drought. With this jump also came nearly 7% of the state moving into the extreme drought categories. Montana’s overall drought footprint held steady at just over 76% of the state, with the extreme categories increasing to nearly 30% of the state. Idaho saw its overall drought footprint jump from just over 60% of the state to 100% now and added nearly 15% of the state in the most extreme drought categories. California also continues to see an increase in the overall area in drought, moving close to nearly 68% of the state, however, the more extreme drought categories dropped slightly to just under 23% of the state now enduring severe drought, all located in the southern portion of the state (Figure 5).
The general pattern of drought concerns across the US remains similar to the past few months (Figure 5; right panel). Large areas of southern California, the southwest, the Rocky Mountains, and the northern to central Plains are likely to see drought conditions persist or develop further, except the monsoon region of the southwest. For the West Coast states, drought concerns heading into summer have risen for central to southern California, the Cascades of Oregon and Washington, along with significant portions of Idaho and Montana, where drought will likely persist or develop further. Much of the eastern third of the country is now forecast to stay out of drought for the rest of the summer (Figure 5; right panel).
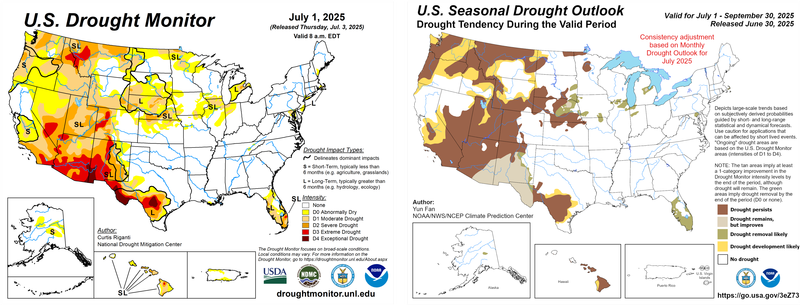
Figure 5 – Current US Drought Monitor and seasonal drought outlook.
ENSO Watch – The ENSO Alert System is not active due to ENSO-neutral conditions remaining in the Tropical Pacific Ocean basin. Observations in June by the Climate Prediction Center (CPC) continue to show conditions in the Tropical Pacific Ocean with near-average sea surface temperatures (SSTs) (Figure 6). Tropical Pacific atmospheric conditions also continue to show anomalies that are consistent with remaining ENSO-neutral at this time. Observations and models are continuing to show a trajectory of SSTs remaining near average over the next few months, with ENSO-neutral prevailing through the summer (82% chance). Recent models that run into the fall and winter, while lower in confidence, have a 48% chance of ENSO-neutral continuing or a transition back to La Nina (41% chance). Heading further into summer, we would expect the overall effect of ENSO on weather conditions for the west coast to continue to weaken. The current 90-day forecast is much less driven by ENSO influences, even though the tropics are moving into their most dynamic time of year to generate tropical storms.
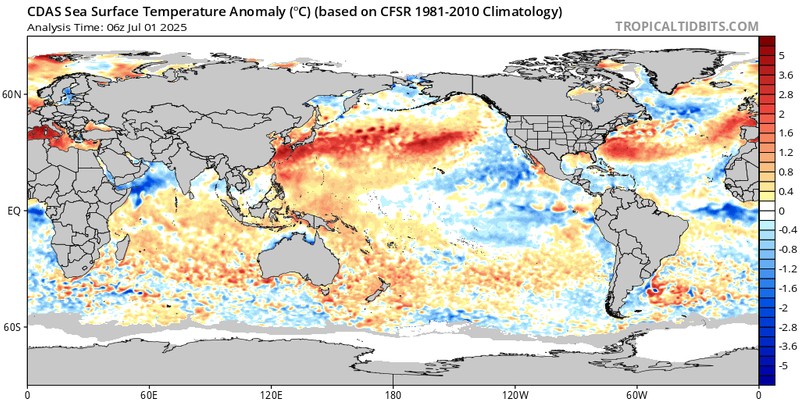
Figure 6 – Global sea surface temperatures (°C) for the period ending July 1, 2025 (image from Tropicaltibits.com).
North Pacific Watch – Not much change in SSTs over the North Pacific with the pattern of temperature anomalies remaining largely the same from last month (Figure 6). The Pacific Decadal Oscillation (PDO) remains in a negative state, although the magnitude remains a little weaker compared to the extreme values that have been in place over the last year or more. A broad area of the North Pacific basin remains much warmer than average, especially extending from the South China Sea, across Japan, and nearly to the west coast of Canada. Cooler than average SSTs also remain along the western North American coast from California south to Baja California and extending southwest toward Hawaii, where it joins with the cooler waters in the ENSO zone (Figure 6). While the PDO is still showing negative phase anomalies and will likely continue for the foreseeable future, its effect tends to lessen in the boreal summer, then picks back up in the fall and transition to winter. Right now, I do not see much influence from the North Pacific SSTs, other than tamping down coastal zone temperatures, especially in California and south to Baja.
Forecast Periods:
Next 5 Days: Warm start to the month will give way to a slight cool down as the high pressure moves eastward. Thunderstorm chances are likely east of the mountains over the next few days. Pleasant 4th of July weekend for most, although still quite warm in the southwest and across the Great Basin. No rain in the forecast except maybe some drizzle in the Olympics.
6-10 Day (valid July 7-11): After a pleasant 4th of July weekend for most, the warmest days of the summer are likely as high pressure builds back to dominate the western US. It will likely be warm and dry pretty much everywhere, except maybe right along the coast in California where closer to average temperatures are forecast. Except for southwest Texas, the rest of the country is also forecast to see above average temperatures along with above normal precipitation.
8-14 Day (valid July 9-15): Above average temperatures over the western US are forecast to continue to mid-month and beyond. Dry for most of the west, except a slight increase in rain chances in the far northwestern areas of the PNW and potential monsoon moisture in the southwest. The monsoon moisture will likely elevate the humidity in the Great Basin and bring increasing potential for thunderstorms. The rest of the country is forecast to have a greater chance of wetter than average conditions and see closer to average temperatures, except right along the Gulf Coast, southeast, and northern New England, where above normal temperatures are forecast.
30 Day (valid July 1-31): The monthly temperature forecast for July is pointing to most of the lower 48 states having a very good chance of above average temperatures (Figure 7). The only exception is along the California coast, where cooler conditions along the coastal zone are forecast to keep temperatures likely closer to average. The precipitation forecast for July varies quite a lot with the bulk of the county having equal chances of above to normal to below amounts in July. For the western US, July is often one of our driest months and will likely stay that way, especially across the PNW. Monsoon flow is forecast for portions of the southwest, increasing the likelihood of a wetter month. Precipitation is expected to be below average in the central Plains and southern Texas and above average from the Gulf Coast, across the southeast, and into southern New England.
90 Day (valid July-August-September): The seasonal outlook for the second half of summer continues to forecast a strong chance that the entire country will see a much warmer July, August, and September (Figure 7). The western US and New England have the greatest chances of seeing a warmer than average summer. Precipitation during the summer months is currently forecast to be below average across the northern states from the PNW to the northern Plains and western Great Lakes. The Gulf Coast, southeast, and eastern seaboard are forecast to see a wetter than average summer (Figure 7), largely due to the higher than average tropical storm season forecasted for the Atlantic and Gulf. The rest of the country, from California to Texas and up into the Great Lakes, has equal chances of above to normal to below average precipitation for this three month period.
Figure 7 – Temperature (left panel) and precipitation (right panel) outlooks for the month of July (top panel) July, August, and September (bottom panel) (Climate Prediction Center, climate.gov).