Weather and Climate Summary and Forecast
February 2026 Report
Gregory V. Jones, Ph.D.
February 7, 2026
Summary:
- January continued the warmer than average* winter across the western US, with the northern Rockies seeing the warmest conditions during the month. Cooler conditions occurred in the western valleys of Oregon due mostly to persistent fog.
- After some precipitation in the first week of January, the month turned very dry with most regions seeing no precipitation over the last 25 days of the month.
- Most of the water year to date precipitation has come as rain, with snowpacks running substantially below normal for most areas. Fortunately, reservoirs are mostly full … for now. The ‘snow drought’ we are currently in is quite concerning, with fewer days to potentially make up the deficits and the seasonal forecast trending warmer than average.
- The prolonged ridge of high pressure that has dominated the weather in the west for the past couple of months is giving way to a couple of systems from now till the 10th, bringing moisture and colder temperatures to the western US (more likely the further north one goes, and less likely south).
- The second half of February is likely to stay warmer and drier than average, leaving most of the western US more likely to see a warmer and drier month.
- The seasonal forecast for now through April is still holding to general La Niña and negative PDO influences, which would favor a near average to cooler and wetter second half of winter across the PNW and northern Rockies, and cool to near average and dry southward into California and the southwest.
*Note that all references to normal or averages in this report are to the 1991-2020 climate normal for each weather/climate parameter unless stated otherwise. See this website for more information on climate normals.
For a PDF of this report, click here.
Past Month and Water Year: Mostly warmer than average over the western US (Figure 1). The warmest conditions were seen in the central and northern Rockies, along with the western Plains, where temperatures were 10-15°F above average for the month of January. High pressure dominated the western US with stable conditions and plenty of valley fog, especially in western Oregon. The ridge in the west also continued the trough pattern in the east, continuing the southward push of much colder Arctic air and lower than average temperatures (5-15°F below) to the Great Lakes, mid-Atlantic, and New England (not shown). The high pressure was strong enough to keep the western states quite dry, with many regions running 70% or less of average January precipitation. The driest regions in the west included most of Oregon (~30% of average), portions of Washington, and a large area of the northern Rockies, with some areas seeing less that 20% of average precipitation for January. The only areas of the western US to see much precipitation in January were in the southwest and Front Range of the southern Rockies (Figure 1). Across the country, January 2026 brought the wettest conditions from New Mexico northeastward to the Great Lakes and from the Gulf Coast into the Ohio River valley as frigid air combined with Gulf moisture led to ice and snow as far south as northern Florida (not shown).
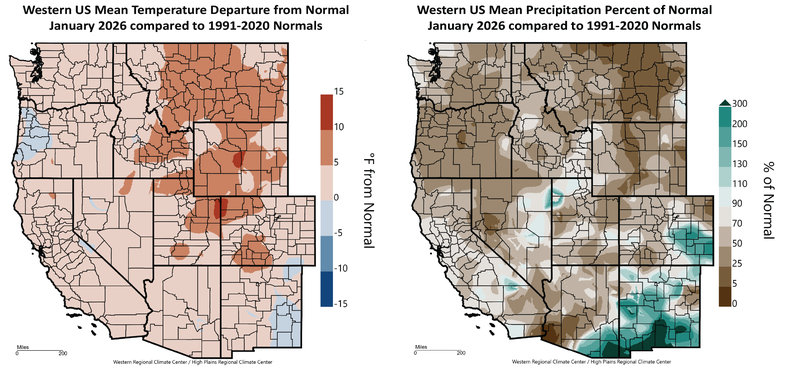
Figure 1 – Western US January 2026 temperature departure from normal (left) and percent of normal precipitation (right; images from WestWide Drought Tracker, Western Region Climate Center; University of Idaho).
The water year to date (October through January) is currently running warmer than average for the vast majority of the western US (Figure 2). Most of the West has seen temperatures between 1-2 degrees above average, with the central Rockies and Plains seeing 4-8 degrees warmer than average. Western valleys in Oregon and Washington, and the Central Valley of California, are running closer to average due to prolonged fog over many days to weeks. For the rest of the country, the Rockies roughly to the Mississippi River have seen largely warmer than average temperatures since October 1 (not shown). The eastern third of the country has seen temperatures 1-5 degrees cooler for the water year to date, with the coldest conditions east of the Great Lakes and into New England (not shown).
Precipitation for the western US for the water year to date is showing a mostly wetter than average California, southwest, and the northern Rockies and Plains (Figure 2). Oregon, southwest Idaho, eastern Nevada, central Utah, and much of the central and southern Rockies have seen 10-60% of normal precipitation. Figure 2 also shows that the eastern portions of Colorado and New Mexico have experienced drier than normal conditions, which extends across the central Plains, the Mississippi River valley, and over most of the eastern third of the country, with water year to date precipitation running 10-60% of normal (not shown).
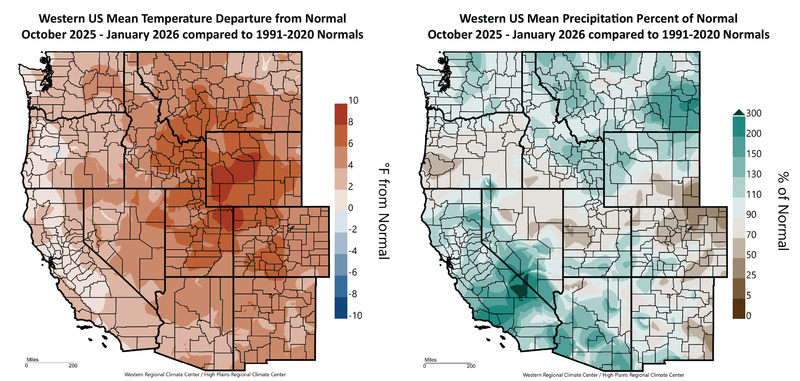
Figure 2 – Western US water year (October 2025 through January 20256) temperature departure from normal (left) and percent of normal precipitation (right; images from WestWide Drought Tracker, Western Region Climate Center; University of Idaho).
Snowpack and Drought Watch – Talk about a dry January! Precipitation amounts over the west during the month were very low (Figure 1), while other areas of the country also saw drought concerns rise (Figure 3). The drought pattern in the west shows the continuing dry conditions in the PNW, Northern to Central Rockies, and the southwest. For the continental US, the overall drought footprint depicted in Figure 3 remained close to 70% (mostly in the south, southeast, and east coast), with the most extreme drought categories increasing slightly to nearly 20%. A dry January in California, the PNW, and most of the intermountain west brought the overall footprint up slightly to just under 68%, with the most extreme categories dropping slightly to 14% of the west in the more severe to exceptional drought conditions. The dry month kept Washington’s overall drought area close to 74%, while the most extreme categories dropped moderately to 3%. Oregon was also drier than average in January (Figure 1), increasing the state’s drought footprint from 60% to 64%, with the extreme drought categories (severe, extreme, and exceptional) remaining close to 5% of the state. Montana also saw an increase in its overall drought footprint to just above 63% of the state in some level of drought, with the extreme categories remaining at nearly 10% of the state. Idaho’s drought footprint rose to nearly 98% of the state now in some level of drought, with the more extreme categories of drought remaining close to 10%. California remains largely free of drought, with only a small amount (1%) of the far northwestern part of the state in the lowest drought category (Figure 3, left panel).
The dry and moderately warm January over the western US (Figure 1) continued the current deficits seen in mountain snowpacks. Snow water equivalent (SWE) in watershed basins across the west is running 5-45% of normal from Washington, across Oregon, into the Basin, and across the southern Rockies and southwest. The southern to central Sierra Nevada mountains and a few basins in the northern Rockies are the only basins seeing near average SWE; however, the lack of snow during the month has even dropped levels below 100% there. The water year to date precipitation amounts in watershed basins across the west are closer to 75-90% of average, to some areas of the northern Rockies and central Sierra Nevada mountains up to 150% of average, indicating the warmer conditions across the west.
The seasonal drought outlook moving into spring continues to point to the likelihood of improvement in drought or removal altogether in the inland PNW, although areas of southern Oregon are in a more persistent drought condition (Figure 3; right panel). California is forecast to remain drought-free, while the southwest remains one of the driest regions in the country. However, the early season lack of snow in the mountains, with most basins currently having extremely low snowpacks and snow water equivalents, means that a flip back to drought would occur without a significant amount of precipitation (rain and snow) coming in the last few months of winter. Dry conditions are also expected to continue or develop further across the Plains, most of Texas, Florida, the southeast, and New England.
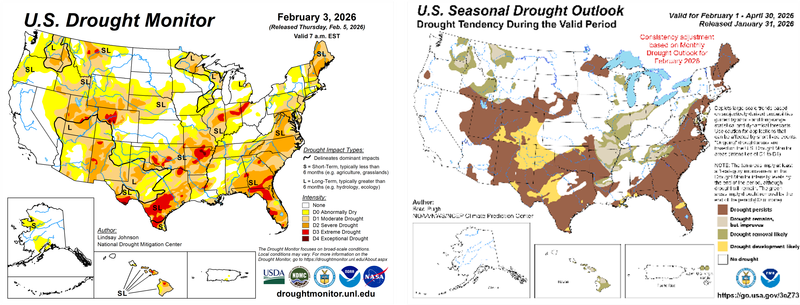
Figure 3 – Current US Drought Monitor and seasonal drought outlook.
ENSO Watch – Conditions in the Tropics are holding in a La Niña state, with the Climate Prediction Center keeping the ENSO alert system in an advisory for now. SSTs in the central-eastern equatorial Pacific remain mostly below average (Figure 4), and the evolution of other key oceanic and atmospheric variables also remains consistent with La Niña conditions. However, models continue to indicate a likely gradual warming trend over the next few months. The Climate Prediction Center continues to forecast that this event will likely be slightly weak and short-lived, and the multi-model forecast continues to favor La Niña for the next month or two, with a transition to ENSO-neutral most likely occurring between January and March (75% chance). While the patterns of weather expected from La Niña conditions have not occurred so far this winter, the seasonal forecast below and drought outlook above are still betting on La Niña bringing a cooler and wetter second half of winter to the PNW, while drier and milder conditions are forecast for California and the southwest.
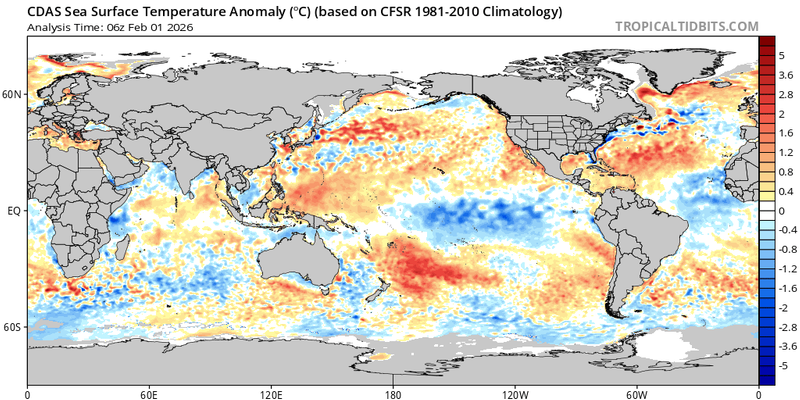
Figure 4 – Global sea surface temperatures (°C) for the period ending February 1, 2026 (image from Tropicaltibits.com).
North Pacific Watch – The overall pattern of SSTs in the North Pacific continues into February (Figure 4). The conditions continue the negative or cool phase that the Pacific Decadal Oscillation (PDO) has been in since late 2019. The Gulf of Alaska remains slightly cooler than average, while near shore SSTs all along western North America remain warmer than average. Warm SSTs also continue over a large area in the central North Pacific, while south of Hawaii, there has been some warming across most of the basin. The current pattern in North Pacific SSTs is largely in phase with the tropical Pacific, which is cooler than average and in a La Niña (see above). The combination of a cold PDO and weak La Niña winter has commonly brought cooler temperatures and higher precipitation amounts to the PNW and northern states, while California and southern states tend to be near normal to warmer than normal and drier than normal during the winter. However, the regionwide warmth and overall dry conditions since October in the West (Figure 2) do not follow the historic relationships between ENSO, PDO, and western US weather and climate (see the 90-day forecast below).
Forecast Periods:
Next 5 Days: The long term dominance of high pressure, sinking air, stable conditions, and no precipitation will wane somewhat over the next few days. Precipitation will return, but mostly from Northern California into the PNW. Cooler temperatures in the more southern and inland parts of the west, but not likely much precipitation.
6-10 Day (valid February 11-15): High pressure builds back in again but is far enough to the west that cooler conditions and the potential for widespread precipitation arrive during this forecast period. A couple of systems will provide coastal rains and mountain snows during this period. It’s not clear how much yet, but anything is better than what we have experienced over the last 30 days or more. While the West sees a small shift, the East gets a big one with the frigid conditions moving out and being replaced by above average temperatures from the middle of the country to the East Coast.
8-14 Day (valid February 13-19): Cooler and wetter conditions remain from the last forecast period, with the western US more likely to see below average temperatures and above average precipitation. The amount and spatial occurrence of mountain snow are still in question, but any amount helps at this point. The eastern half of the country is likely to continue warmer than average with near average to above average precipitation for most areas.
30 Day (valid February 1-28): While the middle of February forecast has cooler and wetter conditions for the western US, the full month outlook is holding to warmer and drier for most areas (Figure 5). A warmer than average month is forecast from the PNW, across the Great Basin and southwest, to Texas, while the eastern US is likely to end up cooler than average for the month. The precipitation forecast for February is pointing to close to average or above average amounts in the northern portions of the PNW and Rockies across to the Northern Plains, while southern Oregon, California, the Great Basin, and central Rockies are forecast to see an overall dry month. Most of the eastern US is forecast for equal chances of above to below average precipitation, except the southeast which is forecast to remain dry (Figure 5).
90 Day (valid February-March-April): The seasonal forecast carries over from the first of the year, incorporating conditions expected from a La Niña into the forecast. However, so far this winter, the observations have not followed these expectations, and I am not so sure they will as we head into spring. Currently, the seasonal temperature outlook calls for a wetter and colder inland PNW across to the Great Lakes and a warmer and drier southern tier of states and into the mid-Atlantic (Figure 5). The area forecast to have the greatest probability of above average temperatures and below average precipitation during the winter includes the southwest, Texas, the southeast, and Florida. The 90-day precipitation forecast points to wetter than average conditions across the inland PNW, the northern Plains, Great Lakes, and Ohio River valley (Figure 5). The signal for winter precipitation is mixed for portions of southern Oregon and northern California with equal chances for below to above average precipitation.
Figure 5 – Temperature (left panel) and precipitation (right panel) outlooks for the month of February (top panel) and February, March, and April (bottom panel) (Climate Prediction Center, climate.gov).