Weather and Climate
Summary and Forecast
March 2026 Report
Gregory V. Jones, Ph.D.
March 3, 2026
Summary:
- The warmer than average* winter for the western US continued in February.
- February brought more normal precipitation to many regions, especially in California, portions of Oregon, and the Intermountain West. But many places across the western US remain very dry.
- Snowpacks remain below normal for most basins in the western US. California and portions of the northern Rockies added some snowpack, but warmer than average temperatures elevated the snow levels elsewhere and melted lower level amounts.
- After returning to a more active storm pattern in February, high pressure is currently building in over the west coast with drier and milder conditions south into California and the southwest. The PNW will see a few week storms ride over the ridge, with light rain and overcast conditions through mid-month.
- Warmer and drier than average conditions for most of the western US during the second half of March. The PNW could see some precipitation, but not likely very much. If the ridge builds as forecast, most storms will be guided north and east, then south into the heartland, where a very wet month is forecast.
- The 90 day seasonal forecast for March through May is not very clear for the PNW, with near normal conditions most likely. The signal is stronger across California and the southwest, with drier and warmer conditions very likely. Southern Oregon appears to have a better chance of near average to a warmer than average spring, but not likely much more than average precipitation from now until the end of the water year.
*Note that all references to normal or averages in this report are to the 1991-2020 climate normal for each weather/climate parameter unless stated otherwise. See this website for more information on climate normals.
For a PDF of this report, click here.
Past Month and Water Year:
The overall warm winter continued over the western US in February (Figure 1). The central and northern Rockies, along with the western Plains, saw the warmest temperatures with departures 5-15°F above average for the month. West coast states of Washington, Oregon, and California were also warmer than average, but more in the 1-3 degree range. The very cold January in the eastern US continued in February with east coast states running 3-5°F below average due to colder Arctic air (not shown). The central portions of the country were similar to the northern Plains with temperatures running 5-10 degrees above normal.
In terms of precipitation, the western US was mixed, with portions of California, Oregon, Washington, and the intermountain west seeing average to above average amounts. Other regions in the west, namely the northern Cascades, northern Plains, central Rockies, and southwest, saw less than 60% of the average for the month, with the driest regions of the southwest seeing little to no precipitation during the month (Figure 1). Across the rest of the country, February 2026 was largely drier than normal, especially in the central to southern Plains, in the Mississippi and Ohio river valleys, and even portions of New England and Florida. A large snow event elevated the southeast to slightly higher than normal for the month (not shown).
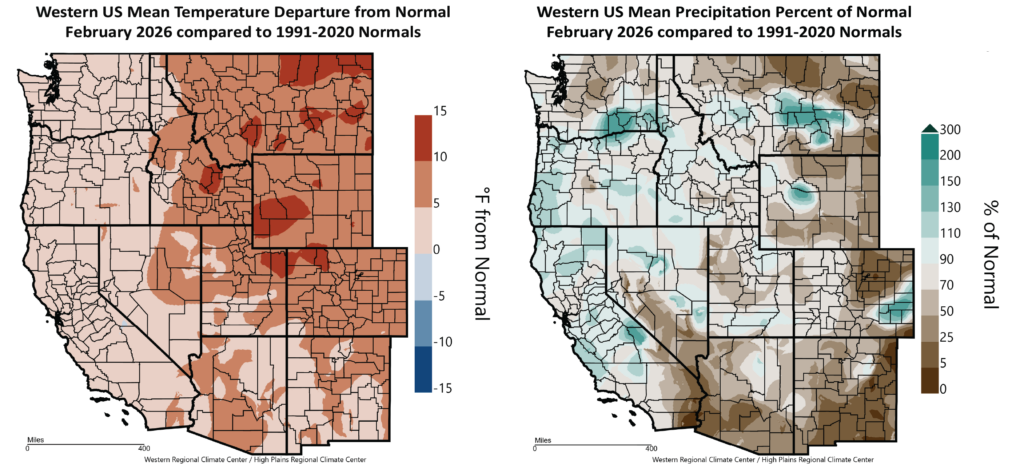
Figure 1 – Western US February 2026 temperature departure from normal (left) and percent of normal precipitation (right; images from WestWide Drought Tracker, Western Region Climate Center; University of Idaho).
October through February (water year to date) is currently running warmer than average across the vast majority of the western US, with the spatial pattern of the five months so far (Figure 2) looking very similar to the month of February (Figure 1). Most of the West has seen temperatures between 1-3 degrees above average, with the central Rockies and Plains seeing 4-8 degrees warmer than average. Western valleys in Oregon and Washington, and the Central Valley of California, are running closer to average due to prolonged fog over many days to weeks earlier in the winter. For the rest of the country, the Rockies roughly to the Mississippi River have seen largely warmer than average temperatures since October 1 (not shown). The eastern third of the country has seen temperatures 1-5 degrees cooler for the water year to date, with the coldest conditions east of the Great Lakes and into New England (not shown).
For the water year to date, western US precipitation has been mostly wetter than average in California, the southwest, and the northern Rockies and Plains (Figure 2). Oregon, southwest Idaho, eastern Nevada, central Utah, and much of the central and southern Rockies have seen 20-80% of normal precipitation. Figure 2 also shows that the eastern portions of Colorado and New Mexico have experienced drier than normal conditions, which extends across the central Plains, the Mississippi River valley, and over most of the eastern third of the country, with water year to date precipitation running 10-60% of normal (not shown).
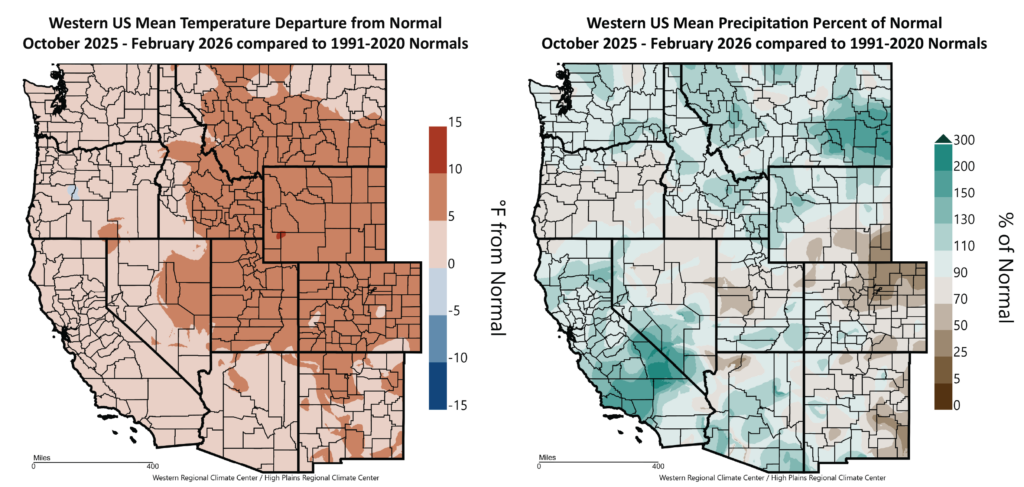
Figure 2 – Western US water year (October 2025 through February 2026) temperature departure from normal (left) and percent of normal precipitation (right; images from WestWide Drought Tracker, Western Region Climate Center; University of Idaho).
Snowpack and Drought Watch:
Some moisture, too much for places that already had plenty (California) and too little for places that really need it (PNW and Rockies). Precipitation amounts over the west during February were moderate and nearing averages for many areas (Figure 1), while other areas of the country saw drought concerns rise (Figure 3). The result is not much change in the overall drought pattern in the west, with continuing dry conditions in the PNW, Northern to Central Rockies, and the southwest, while California is free of drought for now. For the continental US, the overall drought footprint rose to nearly 75% (mostly in the intermountain west, the south, southeast, and east coast) (Figure 3). The most extreme drought categories also increased slightly to just over 23%. A wet February in California and in some areas of the PNW and intermountain west, but dry elsewhere, brought the overall drought footprint up slightly to just under 72%, with the most extreme categories rising slightly to 16% of the west in the more severe to exceptional drought conditions. Washington’s overall drought area rose just slightly to 75%, while the most extreme categories dropped slightly to nearly 2%. Oregon saw a mixed month with some places wetter and some drier than average (Figure 1). The overall result was that the state’s drought footprint rose to nearly 69%, with the extreme drought categories (severe, extreme, and exceptional) remaining close to 5% of the state. Montana remained dry, with its overall drought footprint rising to just above 90% of the state in some level of drought, with the extreme categories increasing to nearly 18% of the state. Idaho’s drought footprint did not change much, remaining close to 96% of the state now in some level of drought, with the more extreme categories of drought remaining close to 10%. California is now completely free of any drought category (Figure 3, left panel).
Warm conditions over the western US (Figure 1) in February continued to influence mountain snowpacks, even as some basins received significant snow during the month. Snow water equivalent (SWE) in watershed basins across the west remains below 50% of normal from Washington, across Oregon, into the Basin, and across the southern Rockies and southwest. The southern to central Sierra Nevada mountains and a few basins in the northern Rockies are the only basins seeing near average SWE (90-100%). The water year to date precipitation amounts in watershed basins across the west are closer to 75-90% of average, except in some areas of the northern Rockies and central Sierra Nevada mountains, where they are 130-140% of average. The percentage differences indicate the warmer conditions across the west.
Heading into spring, the seasonal drought outlook has roughly the same spatial pattern of the likelihood of drought remaining in the southwestern valleys of Oregon and across inland areas of the PNW (Figure 3; right panel). Even though the forecast is for a dry spring in California, the forecast has the state remaining drought-free into May, while the southwest and Rockies remain some of the driest regions in the country. The winter’s lack of snow in most of the mountain basins means that a flip back to drought would likely occur quickly without a significant amount of precipitation (rain and snow) coming in the last months of winter and the start of spring. A wet forecast in March has much of the Mississippi and Ohio river valleys seeing some improvement or removal of drought, while the Gulf, southeast, and east coast is forecast to see drought persist into spring.
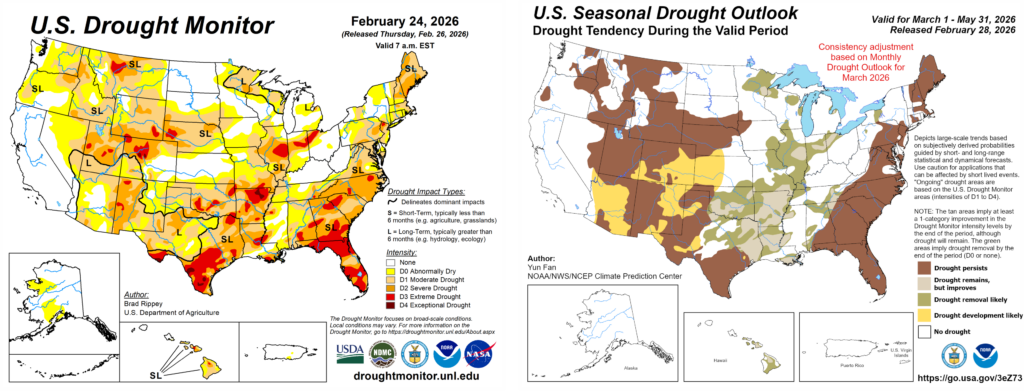
Figure 3 – Current US Drought Monitor and seasonal drought outlook.
ENSO Watch :
The equatorial Pacific region is currently undergoing declining La Niña conditions. However, the Climate Prediction Center is still maintaining the ENSO alert system in a La Niña advisory. Below average SSTs in the central-eastern equatorial Pacific remain (Figure 4); however, warming offshore of South America has become more evident. The current state of other key oceanic and atmospheric variables remains consistent with La Niña conditions but does show weakening. Models continue to indicate a likely gradual warming trend over the next few months, with the Climate Prediction Center forecasting that this event will likely move rapidly to ENSO-neutral during February to April (96% chance). ENSO-neutral remains the dominant category through March-May (90%) and April-June (65%), with El Niño probabilities increasing rapidly as we head further into summer and the fall. We are rapidly moving into a period of the year where the tropics play a lower role in the weather and climate across the western US, and other areas, such as the North Pacific and coastal zone water temperatures play a larger role.
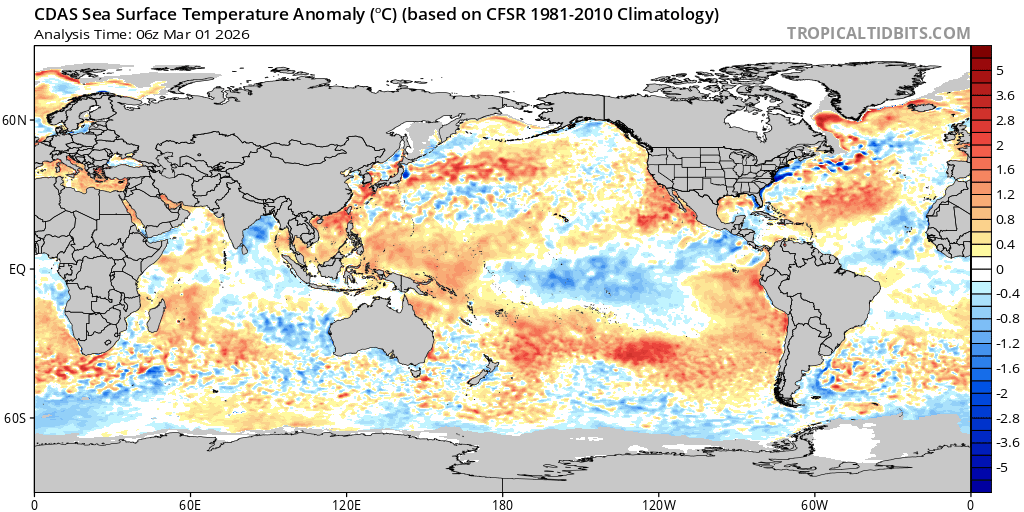
Figure 4 – Global sea surface temperatures (°C) for the period ending March 1, 2026 (image from Tropicaltibits.com).
North Pacific Watch:
SSTs in the North Pacific have not changed much in either the spatial pattern or in the magnitude (Figure 4). The conditions continue to exhibit the negative or cool phase of the Pacific Decadal Oscillation (PDO), which it has been in since late 2019, although the latest readings are indicating some shifting to more neutral conditions. The Gulf of Alaska remains slightly cooler than average, while near-shore SSTs all along western North America remain warmer than average. Warm SSTs also continue over a large area in the central North Pacific, while south of Hawaii, there continues to be warming across most of the basin. Forecasters are pointing to the likelihood of the North Pacific warming even more, which in turn influences the seasonal forecast of warmer and drier conditions for California and the Intermountain West, with the PNW a little more unsure at this point (as shown in Figure 5 and described in the 90-day forecast below).
Forecast Periods:
Next 5 Days: High pressure is building to the west of California, ultimately bringing drier conditions over the west. A couple of systems sliding over the top of high pressure will keep cloud cover and some precipitation from Oregon northward. But mild temperatures will likely move the snow level higher over the Cascades. Seasonal to slightly warmer temperatures north across the PNW and mild to warm temperatures and dry for California and the southwest.
6-10 Day (valid March 7-11): High pressure along the west coast increases its influence with warmer and drier conditions likely for most of the coastal states. Frontal systems will move over the northern portion of the ridge, then dip south into the Rockies and Plains, bringing near normal temperatures and near normal to elevated precipitation chances. Eastern US warms up significantly while the storm track develops from Texas into the Mississippi and Ohio river valleys and into the Great Lakes, bringing a very wet period to the regions.
8-14 Day (valid March 9-15): High pressure continues to dominate the west with above average temperatures and dry conditions across California and portions of the PNW. Any precipitation is likely to develop on the eastern side of the ridge with decent snow chances in the Rockies into mid-month, otherwise likely below average precipitation elsewhere in the west. The warm conditions are likely to continue from the Mississippi across the eastern third of the country, producing the ‘big melt’ from the record snows of a week ago. Storm track shifts slightly east, bringing above average precipitation to the East Coast (rain, not snow).
30 Day (valid March 1-31): March appears headed to a generally warmer period for much of the US (Figure 5). The warmest conditions are likely to be seen across the southeast, California, and the southwest. The northern tier of states, from the PNW across to the Great Lakes, have equal chances of slightly below to slightly above temperatures for the month. The high pressure currently developing in the west is forecast to keep March relatively dry across California and portions of the surrounding states, while equal chances of wetter to drier conditions are forecast for the rest of the west. The storm track developing in the heartland currently will likely dump a lot of rain during March, ultimately leaning the month to above average precipitation and possibly breaking some of the drought in the region (Figure 3). Most of the eastern US is forecast for equal chances of above to below average precipitation, except Florida, which is forecast to remain dry (Figure 5).
90 Day (valid March-April-May): Heading into spring, the seasonal temperature outlook calls for the PNW to have equal chances for below to above average while California and the southwest are much more likely to see warmer than average conditions (Figure 5). A warmer than average spring is forecast across the southern tier of states, while the forecast is not as clear across the northern states. The 90-day precipitation forecast through to May points to drier than average conditions across California, the southern portions of the Great Basin, the southern Rockies, and the Four Corners region. A wetter than average spring is forecast across the Great Lakes and Ohio River valley, while the rest of the country, including the PNW and northern Rockies, has equal chances for below to above average precipitation (Figure 5).
Figure 7 – Temperature (left panel) and precipitation (right panel) outlooks for the month of March (top panel) and March, April, and May (bottom panel) (Climate Prediction Center, climate.gov).