Weather and Climate
Summary and Forecast
July 2026 Report
Gregory V. Jones, Ph.D.
July 1, 2026
Summary:
- A cool end to June for much of the western US, but a warmer than average* month overall.
- June was mostly dry over the west, with localized wetter than normal conditions in western Washington, northern Nevada, the Plains in Montana, and the Southwest, where monsoon flow has started.
The drought footprint in the western US is now at 91% and is likely to expand in the PNW as the summer dry and warm period sets in, while forecasted monsoon flow is expected to lower drought levels in the Southwest and Great Basin. The first Tropical storm of the year has lowered drought concerns along the Gulf Coast and Southeast, while the mid-Atlantic region is forecast to remain dry this summer. - The current cool conditions over the west will transition to seasonal by the weekend for most, then build to warmer than average by mid-month. Forecast confidence depends on the Pacific high pressure area shifting eastward to its normal position closer to the West Coast.
- The July forecast is calling for warm and dry conditions over the western US, especially across the PNW. However, subtropical moisture could bring higher humidity and the threat of thunderstorms throughout much of the Intermountain West.
- The seasonal forecast for the western US also continues to call for warm and mostly dry. However, El Niño developments in the Tropical Pacific are expected to increase monsoon flow into the Southwest and possibly across much of the West. Models are pointing to likely more eastern Pacific hurricanes, stronger monsoon flow, increased humidity over the west, and the threat of thunderstorms regionwide.
*Note that all references to normal or averages in this report are to the 1991-2020 climate normal for each weather/climate parameter unless stated otherwise. See this website for more information on climate normals.
For a PDF of this report, click here.
Past Month and Year to Date:
While the second half of June was mostly unseasonably cool, the month ended up mostly warmer than average over the western US. (Figure 1 has a scale bar that is extended to +15 degrees, which I cannot control and masks the more subtle differences for most regions.) Most of the West saw temperatures in June that were 1-3 degrees above average, although portions of the Great Basin and Four Corners had departures of 3-10 degrees above average. Below average temperatures were experienced in portions of the northern Rockies and the Plains of Montana as cooler air moved over the ridge in the west. Cooler than normal conditions were also seen across the Great Lakes and into the southeastern US, while the rest of the eastern US had a warmer than average month (not shown).
Seasonally dry conditions were experienced over most of the western US in June, with the majority of California, the Great Basin, the inland PNW, and the Rockies experiencing generally less than 50% of average precipitation (Figure 1). Portions of western Washington and northwest Oregon received some precipitation later in the month, leading to above average amounts. Northern Nevada and southeastern Oregon had some significant thunderstorms during the month leading to over 150% of normal in some areas. Two other areas of note with higher than normal precipitation in June include the Golden Triangle of Montana, with thunderstorms moving in from Canada, and in Arizona and New Mexico, where monsoon moisture brought 110-300% of normal precipitation (Figure 1). The mid-section of the country experienced a mostly wetter than average June, with areas from Texas across the south receiving moisture from the first tropical storm of the season. An active storm track across the Ohio River valley brought substantial precipitation amounts (150-300% or more) to the region, while Florida, the southeast, and the mid-Atlantic experienced a dry June with 50-75% of normal precipitation.
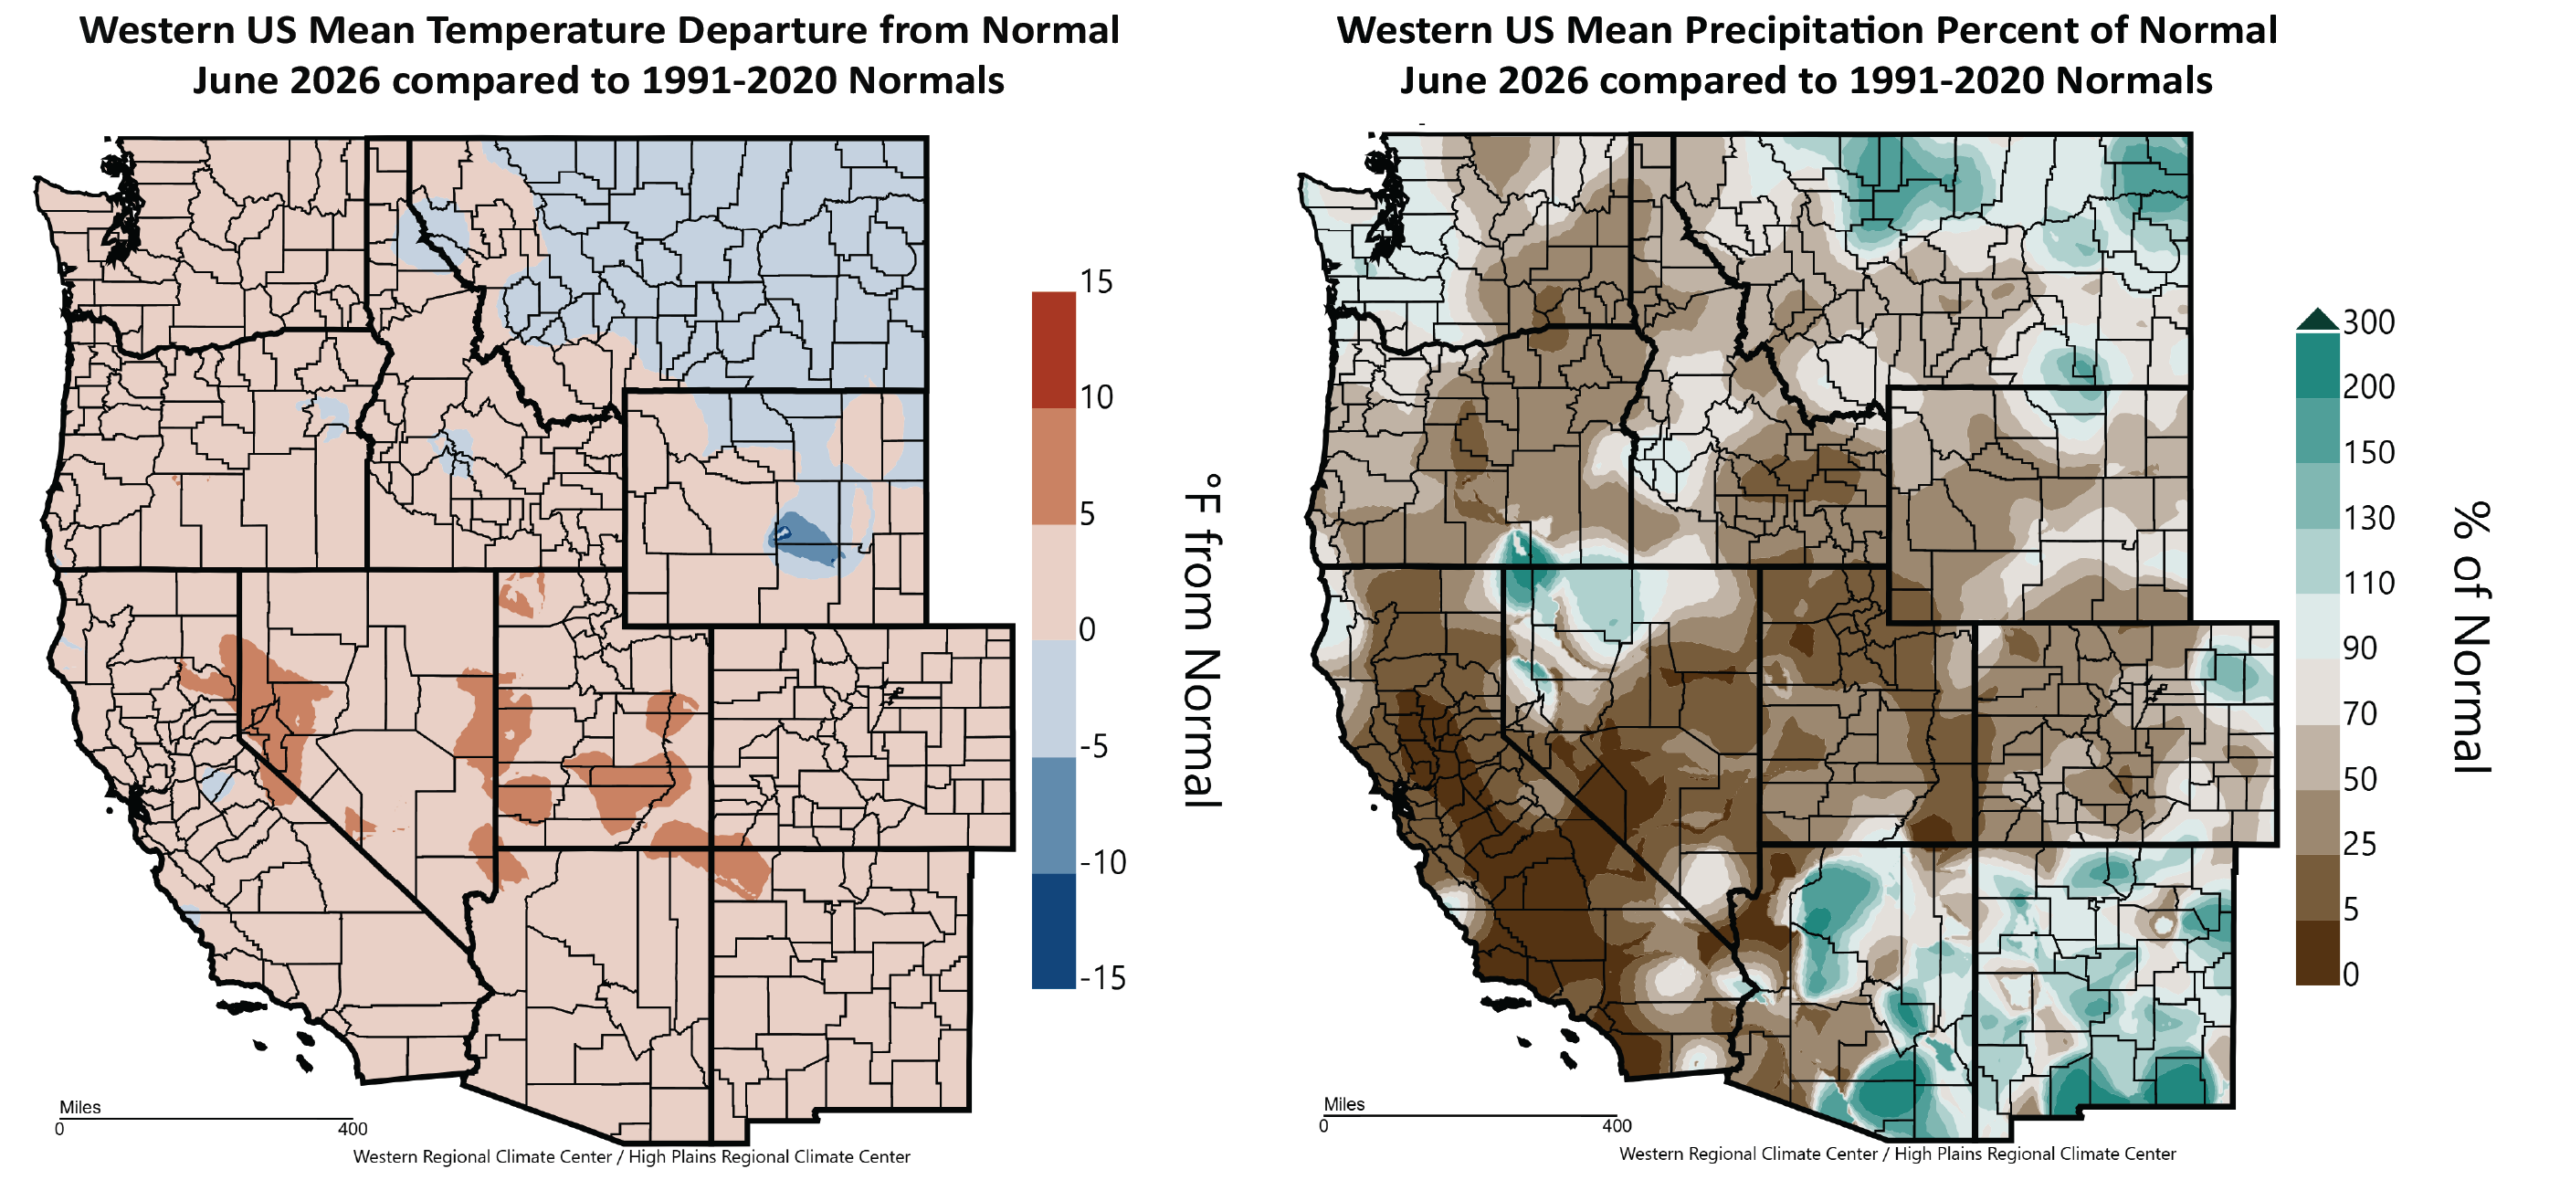
Figure 1 – Western US June 2026 temperature departure from normal (left) and percent of normal precipitation (right; images from WestWide Drought Tracker, Western Region Climate Center; University of Idaho).
Halfway through 2026, the year has seen temperatures between 1 and nearly 8 degrees above average across the western US (Figure 2). The southwest, portions of the Great Basin, and most of the Rockies have seen the warmest conditions through June, while western Oregon and Washington have seen temperatures 1-2 degrees above average. Similar to the western US, most of the rest of the country has seen warmer-than-average temperatures since the first of the year, running 1-4 degrees above average from Texas and the Mississippi River Valley to the Great Lakes and the Southeast. The northeastern Great Lakes and portions of New England have seen closer to average or slightly cooler year to date conditions (not shown).
From January through June, precipitation amounts over the western US have remained mostly drier than normal (Figure 2), although isolated areas in the inland PNW, northern Rockies, and southern Arizona and New Mexico have been wetter than normal. Year to date drier than average conditions are also found in the central to northern Plains, the southeast, and Florida (not shown), while portions of Texas, the Gulf Coast, the Ohio River valley, and Great Lakes have experienced roughly 150-250% of average precipitation.
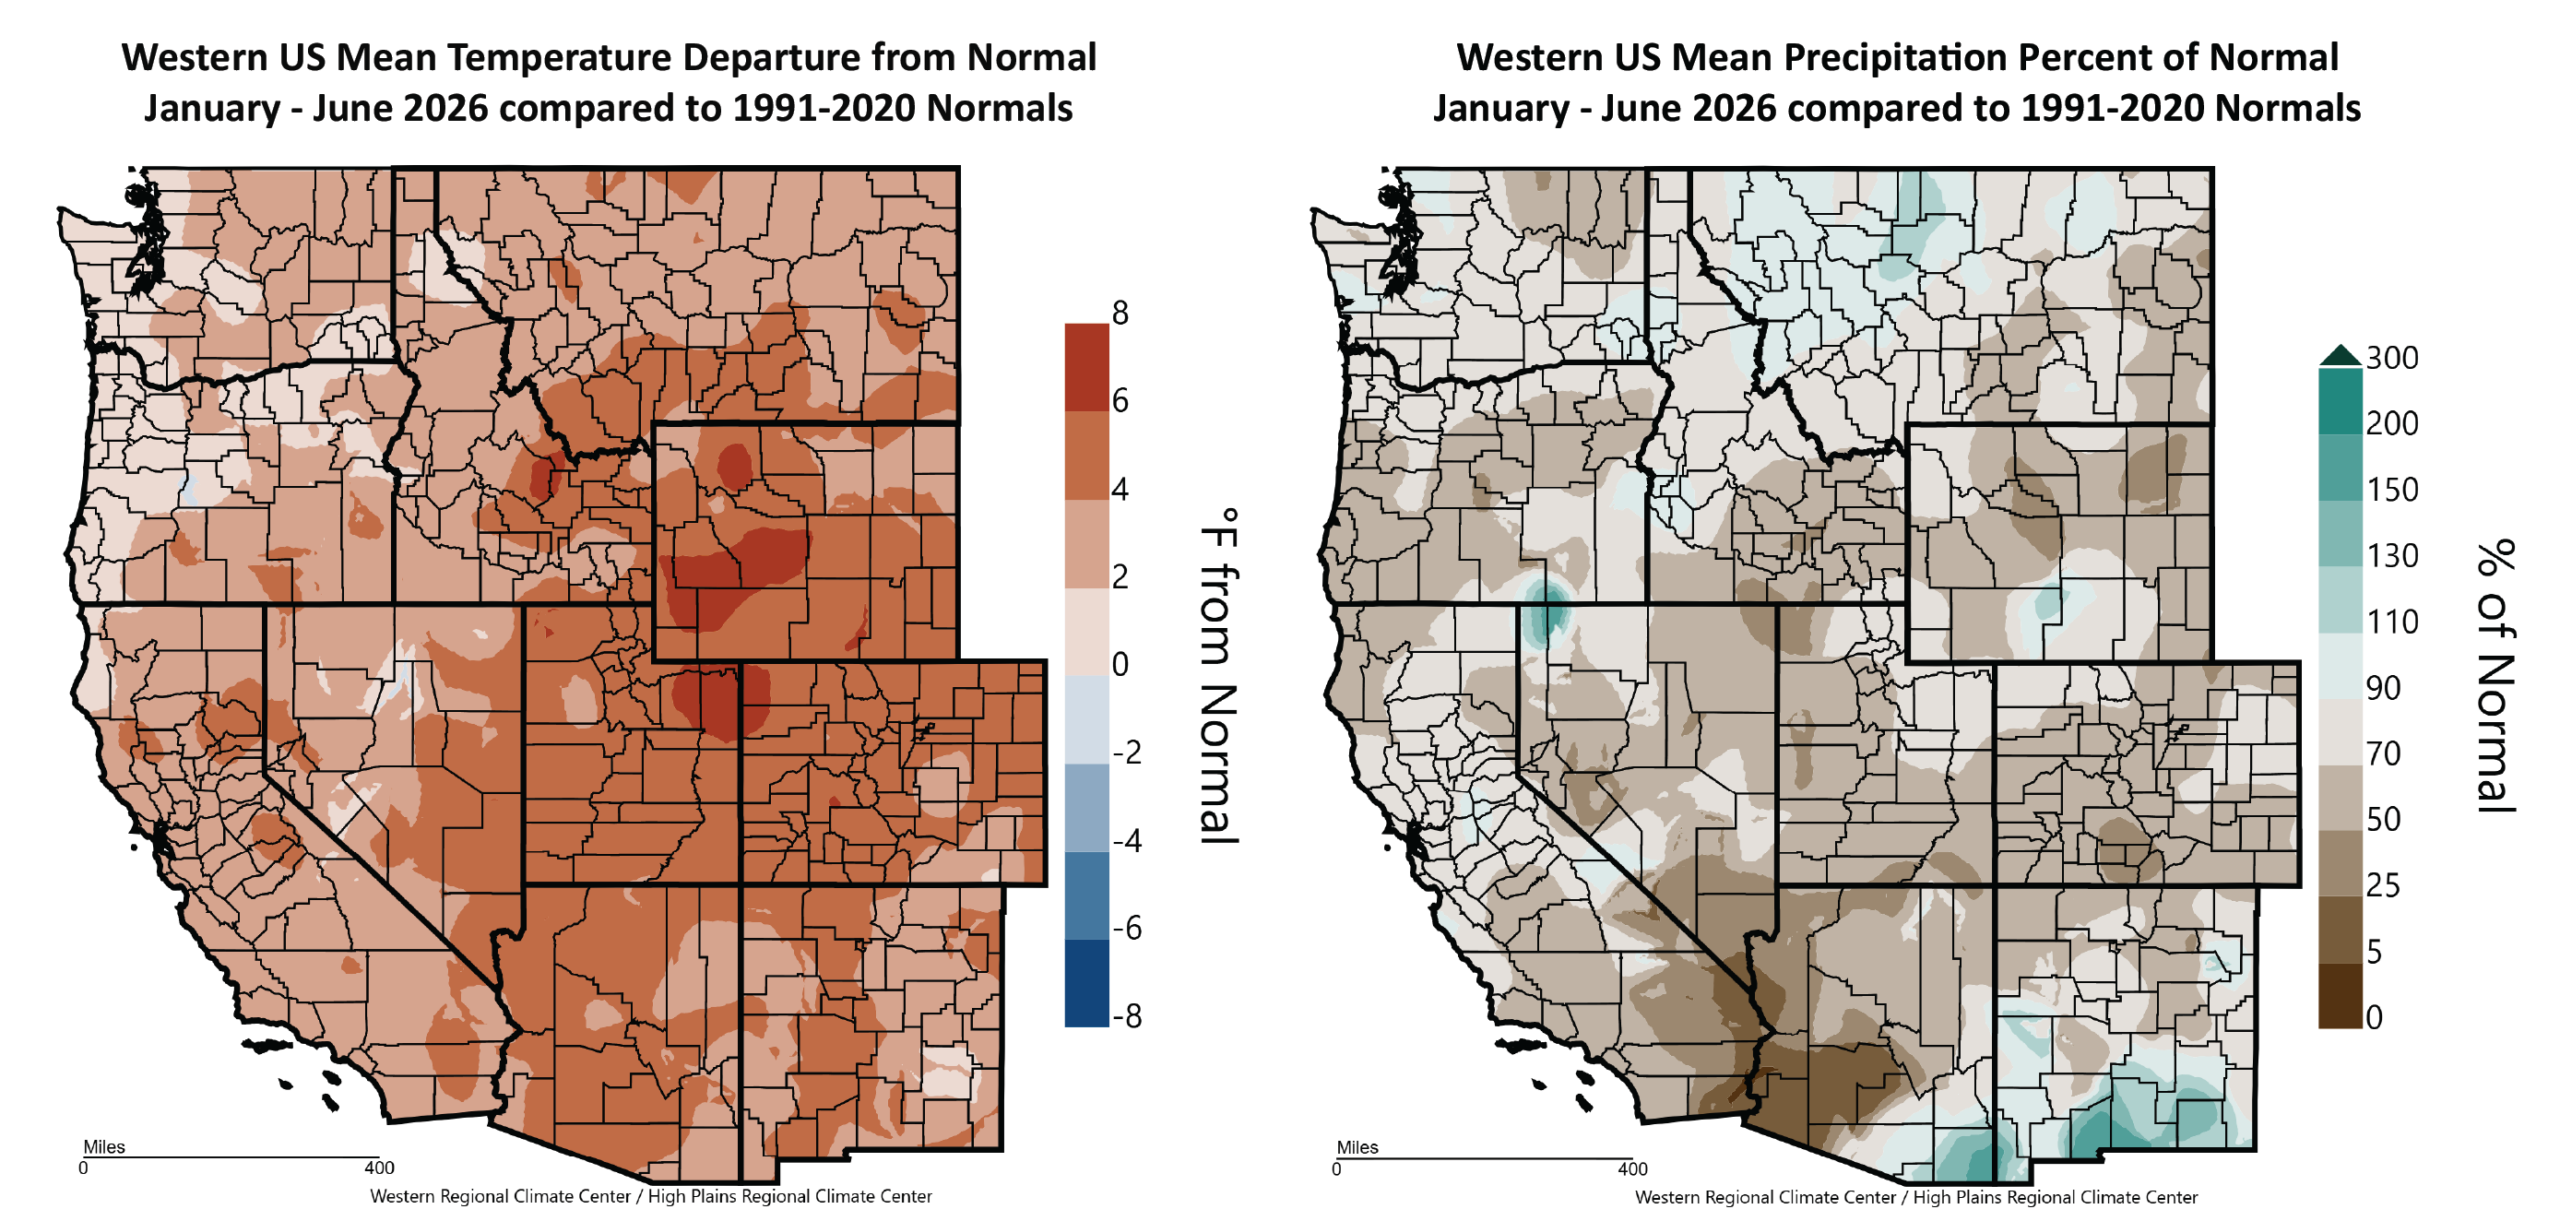
Figure 2 – Western US year to date (January through June 2026) temperature departure from normal (left) and percent of normal precipitation (right; images from WestWide Drought Tracker, Western Region Climate Center; University of Idaho).
Heat Accumulation:
After four months of the 2026 growing season, heat accumulation over the western US shows most areas experiencing above average growing degree-days (GDDs) (Figure 3). California and the southwest are running 300-500 GDD above average, while Southern Oregon northward into the PNW is running 100-300 GDD above average. Mountain regions in the Sierra Nevada, Cascades, and the northern Rockies are closer to average or slightly below average (Figure 3). Converting the mapped data in Figure 3 to days ahead or days behind normal finds California and the southwest mostly 20-30 days ahead, while the PNW is 10-20 days ahead of normal accumulation amounts (not shown).
Mid-season GDDs in four wine regions in Oregon confirm the above average amounts mapped in Figure 3. GDD values at the end of June 2026, compared to the averages from 1981-2010 and 1991-2020 climate normals for the month of June, show that they are 18-60% and 3-42% above average, respectively (Figure 4). A cool end to the month lowered values from near record accumulation to start the month. These locations also range from 4% (Medford), 3% (Roseburg), and 1% (Milton-Freewater) below the same period in 2025, to 16% above for McMinnville.
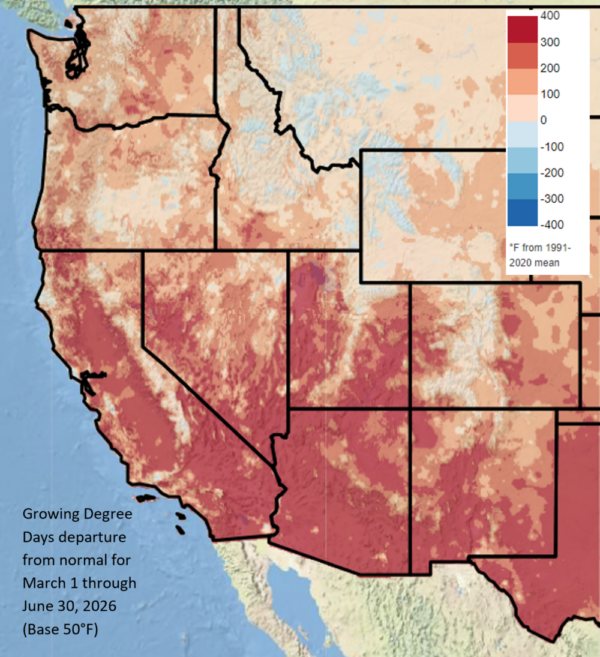
Figure 3 – Western US March through June 2026 growing degree-days (image from Climate Impacts Research Consortium, University of Idaho).
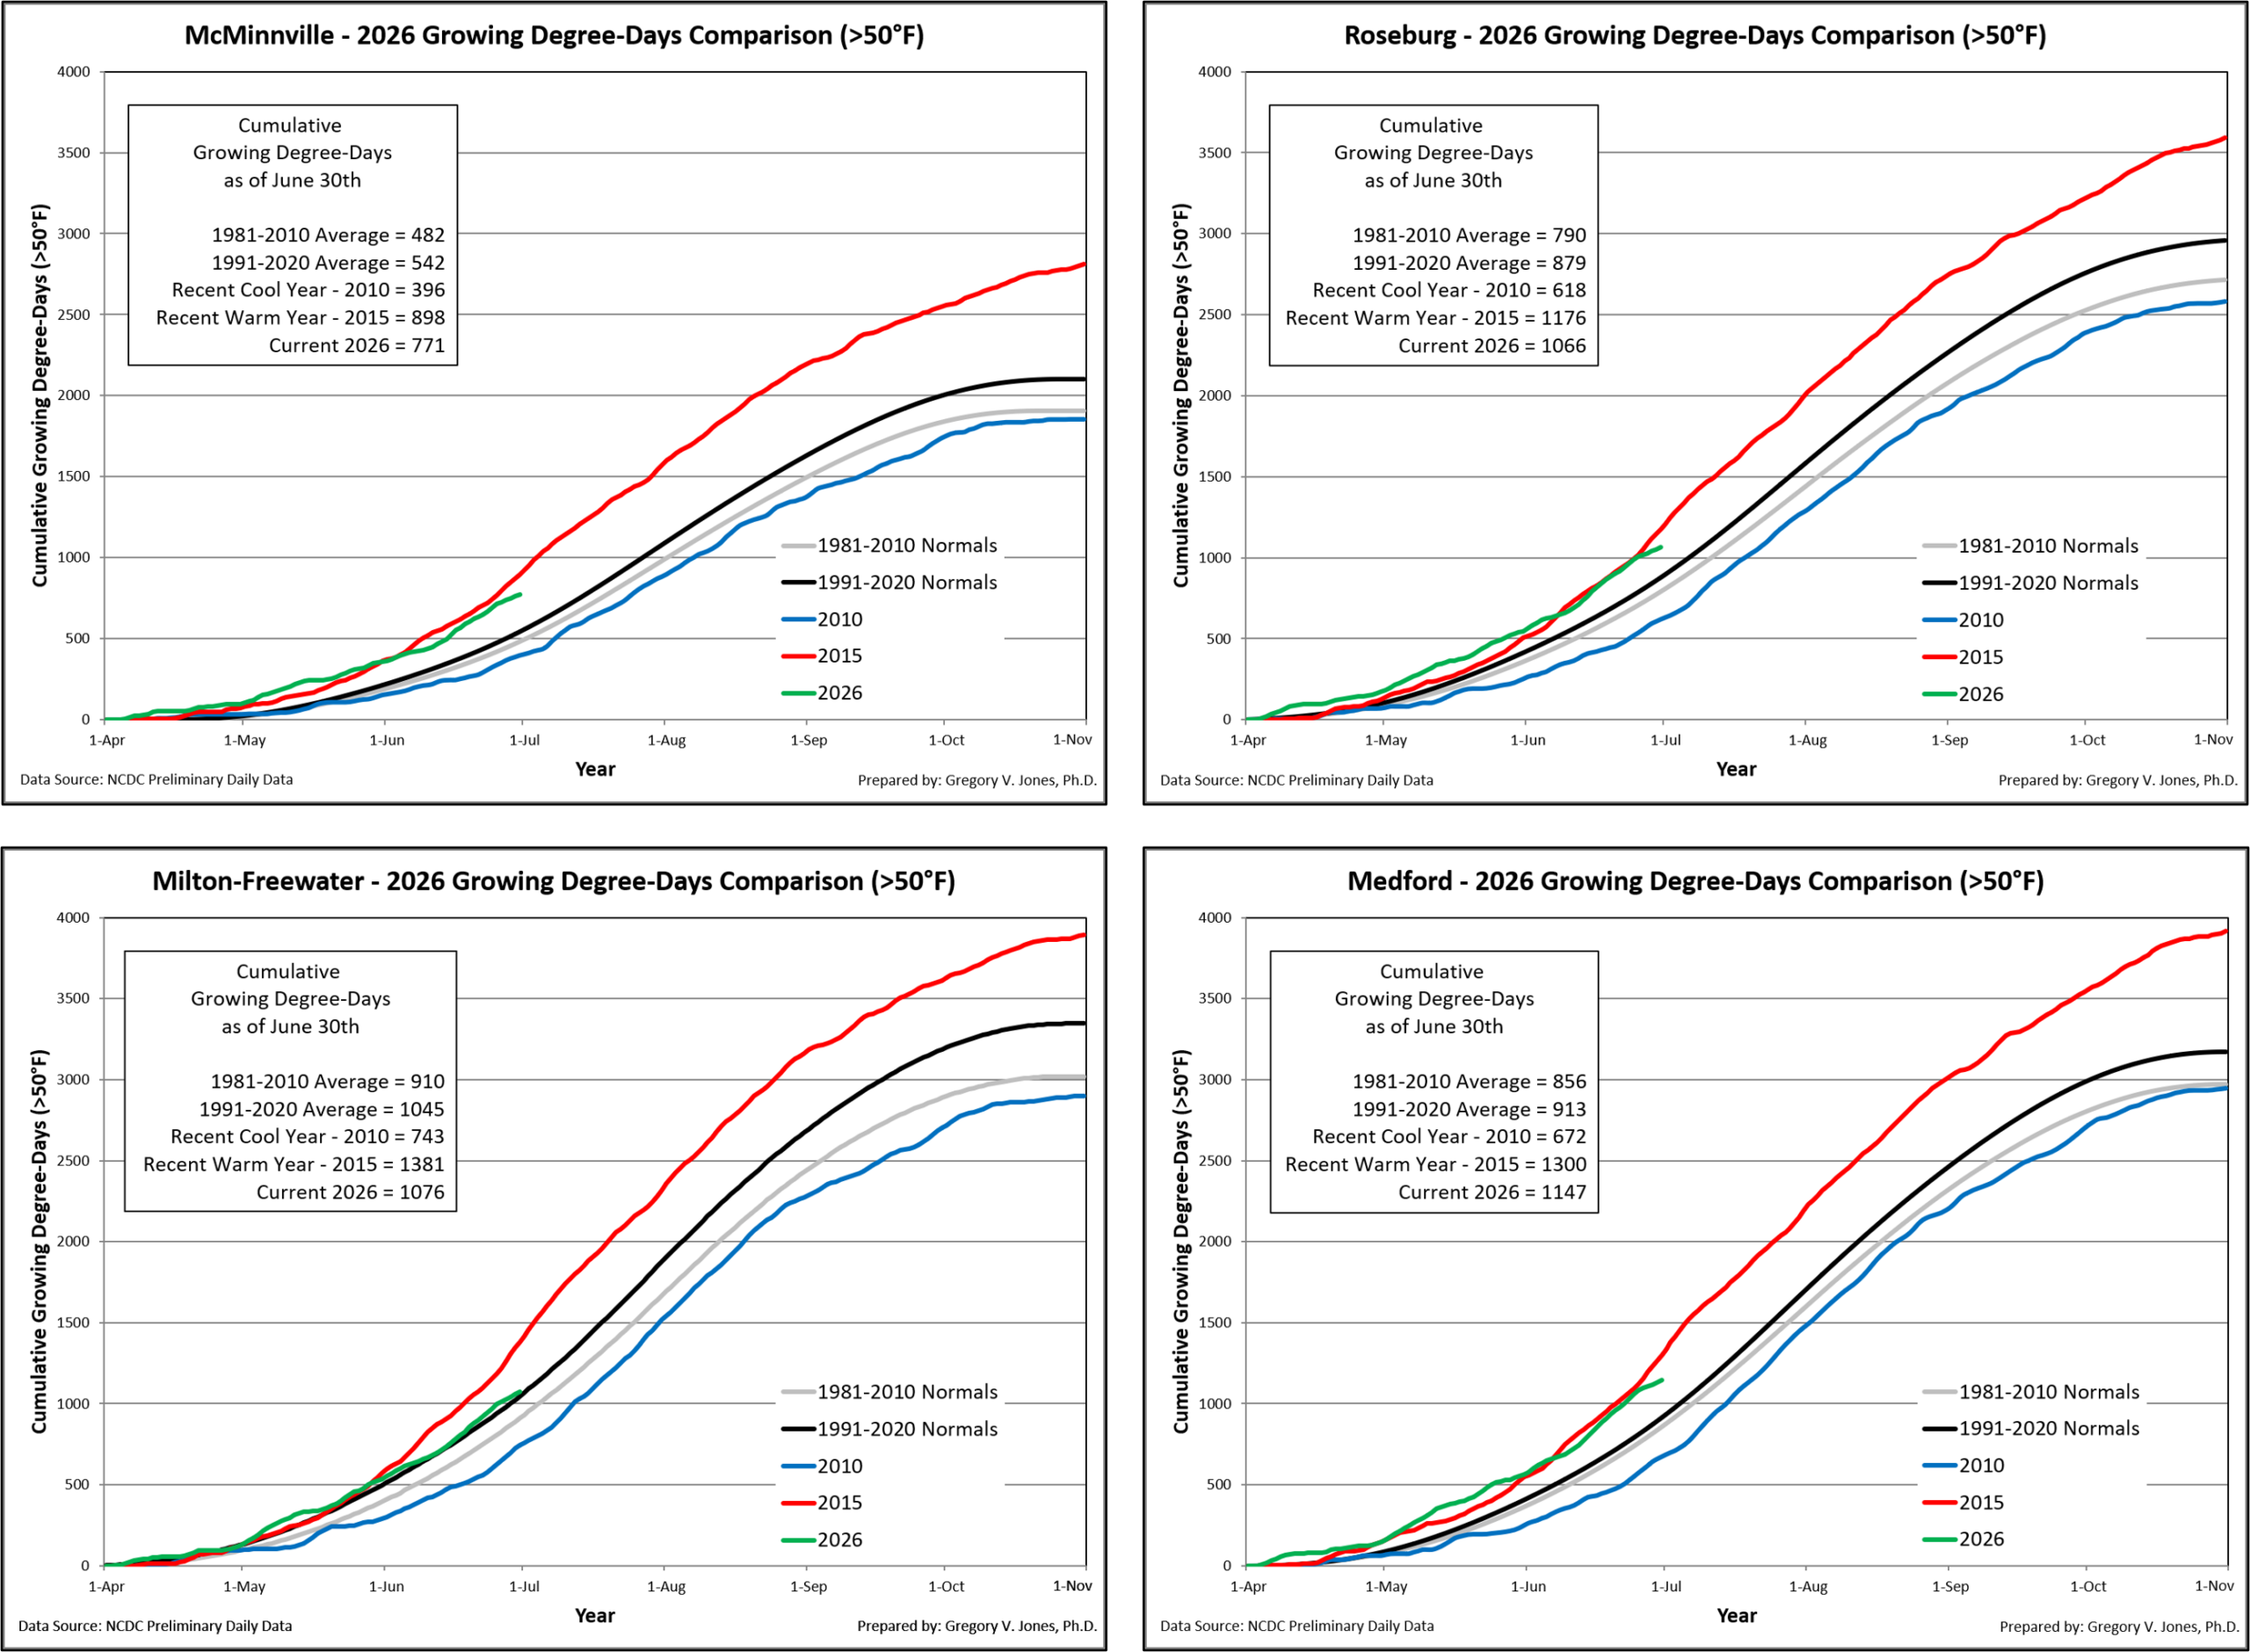
Figure 4 – Cumulative growing degree-days (base 50°F, no upper cut-off) for McMinnville, Roseburg, Milton-Freewater, and Medford, Oregon. Comparisons between the current year (2026) and a recent cool year (2010), a recent warm year (2015), and both the 1981-2010 and 1991-2020 climate normals are shown (NCDC preliminary daily data).
Drought Watch:
Slightly cooler and wetter conditions in a few locations over the west in June helped lower drought concerns for some, while concerns increased for others (Figure 5). Conditions were similar across the US, with some areas seeing drought relief, while others saw drought concerns develop or worsen. For the continental US, the overall drought footprint dropped slightly to just under 70%, with the most extreme drought categories also dropping to just under 34%. Overall dry conditions in the western US during June kept the overall drought footprint right at 91%, with the most extreme categories rising slightly to just under 53% of the west. By state, seasonal dry conditions have kept California at just over 60% in drought, with no area in the more extreme categories of drought at month’s end. Oregon’s drought footprint increased slightly to just over 97% of the state, with the extreme drought categories (severe, extreme, and exceptional) rising from last month to nearly 55% now. While some precipitation in western Washington lowered drought concerns there, the eastern part of the state was quite dry in June, causing the overall drought footprint to rise to just under 85% in drought, with a slight rise in the most extreme categories of drought to 8%. June saw some places drier than average and some wetter than average in the mountains of northern Idaho and western Montana. Montana had enough rain to drop the overall drought footprint to 86%, with the extreme categories dropping to close to 31% of the state. Idaho’s drought concerns did not change from last month, with its overall drought footprint remaining at 100% of the state, with the most extreme drought categories rising again in June to nearly 58% (Figure 5).
The seasonal drought outlook (Figure 5; right panel) is now pointing to drought improvement in many areas of the country. The Southwest, Four Corners, and portions of the Great Basin are forecast to see an active monsoon season, which is tilting the odds to a lessening of drought concerns. After a wet June, the Gulf Coast states and the Southeast are also forecast to see drought conditions improve. However, the Piedmont and Appalachian mountains into the mid-Atlantic are likely to see drought persist. Much of the Great Plains across to the western Great Lakes states and south into portions of Texas, is forecast to remain in drought or see drought develop further. For the West Coast states, central to northern California, most of Oregon, and significant portions of Washington, Idaho, and Montana are likely to see drought conditions develop further as we head into our seasonal dry months (Figure 5; right panel).
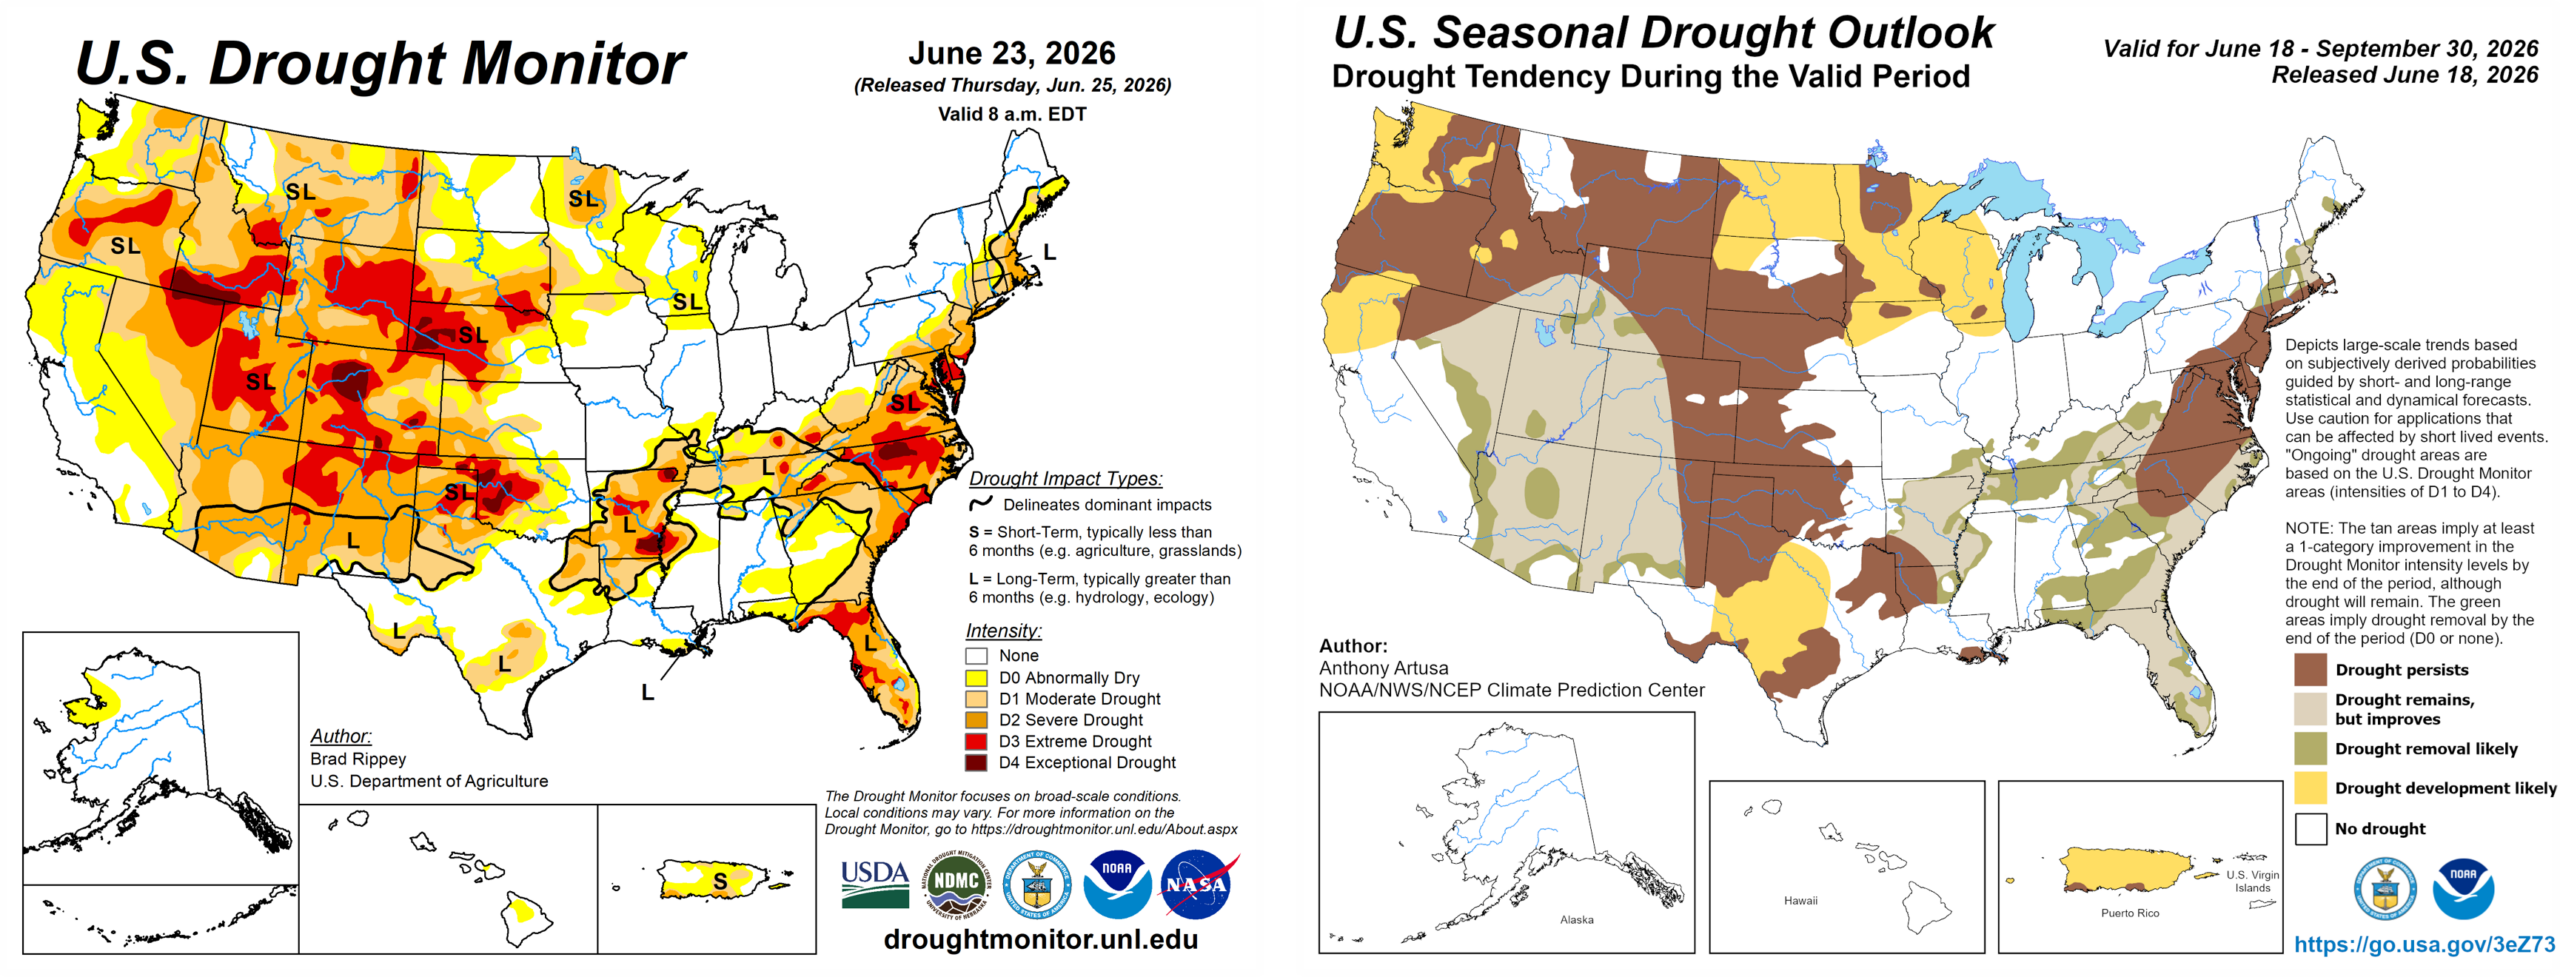
Figure 5 – Current US Drought Monitor and seasonal drought outlook.
ENSO Watch :
El Niño conditions continue to develop across the east-central equatorial Pacific Ocean with warmer than average sea surface temperatures (SSTs) expanding across the basin (Figure 6). Tropical Pacific atmospheric conditions have also developed anomalies that are consistent with El Niño. As such, the Climate Prediction Center (CPC) has issued an El Niño Advisory in its alert system. Ocean and atmosphere conditions and models continue to show El Niño conditions are expected to strengthen into the Northern Hemisphere fall and winter (100% chance). The probabilistic strength outlook now has a 63% chance of a ‘very strong’ El Niño during the November 2026 to January 2027 period. If the ocean and atmosphere continue to couple as we move from summer to fall, the chance that this event will be a strong El Niño is more likely. As I have said here previously, it is also important to note that stronger El Niño events do not guarantee strong impacts; they can only make certain aspects of regional effects more likely. A more active monsoon season is one of the more likely aspects, with seasonal outlooks leaning towards increasing monsoon flow in the 90 day forecast.
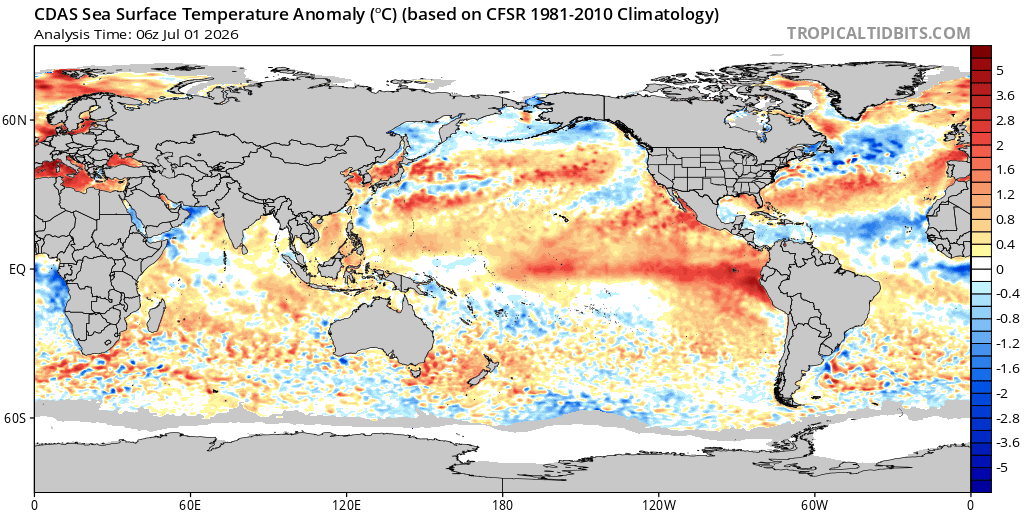
Figure 6 – Global sea surface temperatures (°C) for the period ending July 1, 2026 (image from Tropicaltibits.com).
North Pacific Watch:
SSTs over the North Pacific continue to show a broad area of the basin remaining warmer than average (Figure 6). In addition, the Gulf of Alaska, the western North American coast, and southwesterly toward Hawaii have shown some warming over the last month. Forecasters have been watching these areas closely because of their role in supporting or muting El Niño effects. If the Gulf of Alaska continues to warm, then the El Niño effects could be amplified, but if the SSTs in the region remain cool, some of the El Niño effects on western North America could be muted (see the 90-day forecast below). The PDO is currently showing negative phase anomalies and will likely continue for the rest of the year, but its effect tends to lessen heading into the boreal summer, then picks back up in the fall and the transition to winter, which would follow the timing of the developing El Niño.
Forecast Periods:
Next 5 Days: June ended with cooler than expected conditions and some rain north. This was due to our normal high pressure area shifting much further west, allowing flow to ride over the northern edge of the ridge. The ridge will likely slowly build in closer to the coast, and the low pressure area will likely drift northeastward. Cooler than average temperatures over most of the west will shift to more seasonal temperatures toward the weekend. Rain chances are still in play across northern Oregon and western Washington, but accumulation should be relatively low. Locations southward will not likely see much, if any, precipitation.
6-10 Day (valid July 5-9): Coastal temperatures will likely remain near normal during this period as the ridge builds eastward. Southern California, the Southwest, and the Great Basin are likely to warm up to above average temperatures. The entire eastern US is forecast to also see above normal temperatures during this period. Not much precipitation is expected over the western US during this forecast period. Near normal to slightly above amounts are forecast for the northern border across to the northern Plains, and below normal precipitation is forecast for the Great Basin. Regions from Texas across the lower Mississippi River valley, into the Ohio River valley, across the southeast, and into the mid-Atlantic are forecast to see above average precipitation during this period.
8-14 Day (valid July 7-13): The entire country is forecast to experience above normal temperatures heading into mid-month. The highest forecast confidence for above-normal temperatures remains centered over the west, especially in the Great Basin, along with the southeast coastal zones and Florida. Near normal to below normal precipitation is forecast for most of the west and into the northern Plains and western Great Lakes, with above normal precipitation forecast in the northern Plains of Montana, the Ohio River valley, southeast, and New England. Monsoon flow will also likely increase precipitation chances in the southwest.
30 Day (valid July 1-31): The monthly temperature outlook has the western US, southern states, and eastern seaboard expected to experience a warmer than average month (Figure 7). The highest forecast confidence for above-normal temperatures is given for the PNW and the Southeast. Equal chances of below, near, or above-normal temperatures are forecast for the northern to central Plains, the Great Lakes region, and the Ohio River valley, where a more variable temperature pattern is expected this summer. The monthly outlook for precipitation has most of the country with equal chances of seeing above, average, or below amounts during July. The northwestern PNW, the northern Plains, south Texas, and most of Louisiana are forecast for below normal precipitation. A wetter than average month is most likely in portions of the southwest, where early season monsoon flow has been forecast for a while now. The only region in the eastern US that is forecast for above normal precipitation for the month is in the Ohio River valley (Figure 7).
90 Day (valid July-August-September): The 90 day seasonal outlook through September continues to tilt toward high pressure and warm temperatures in the west and low pressure and cooler temperatures in the east (Figure 7). The highest forecast confidence for above-normal temperatures over the next three months is centered over the PNW, with decent chances of warmer than average temperatures across the west, south, and eastern seaboard. Equal chances of below, near, or above-normal temperatures are forecast for the Midwest and Great Lakes, where a more variable temperature pattern is expected over the next 90 days. For precipitation, there is high confidence in below average amounts in the PNW, northern Plains, and the Texas Gulf Coast region. The area that has the greatest probability for above average precipitation is the southwest, Four Corners, and central Rockies, where enhanced monsoon flow is forecast (Figure 7).

Figure 7 – Temperature (left panel) and precipitation (right panel) outlooks for the month of July (top panel) and July, August, and September (bottom panel) (Climate Prediction Center, climate.gov).